视觉可视化分析与设计
Visualization Analysis and Design
What's Vis, and Why Do it
Computer-based visualization systems provide visual representations of datasets designed to help people carry out tasks more effectively.
What: Data Abstraction
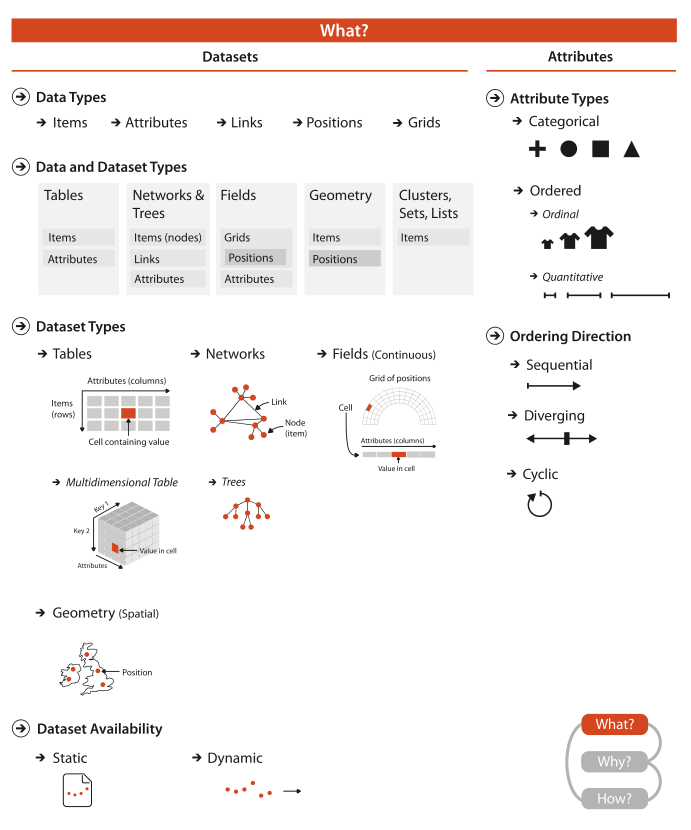
Data Types

Items
Attributes
Links
Positions
Grids
Dataset Types
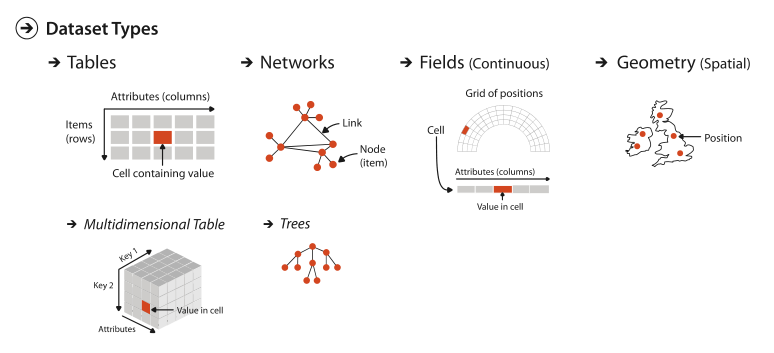
Tables
Networks
Fields
Geometry
Attribute Types
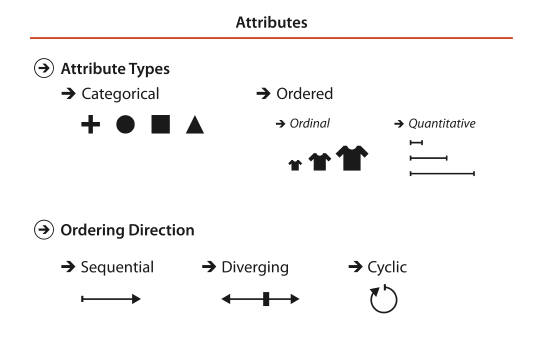
Categorical
Ordered
Ordinal
Quantitative
Semantics
Key
Flat Tables
Multidimensional Tables
Values
Fields
Scalar
Vector
Tensor
Why: Task Abstraction
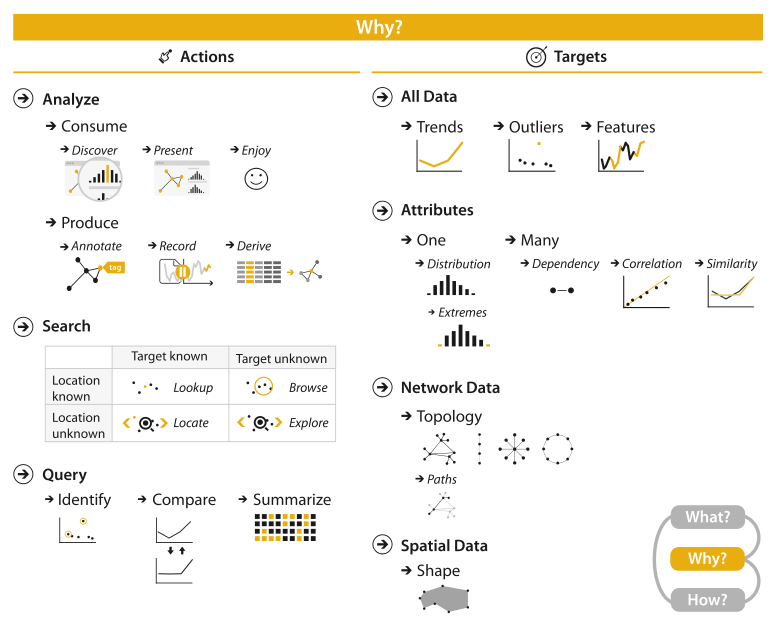
Actions
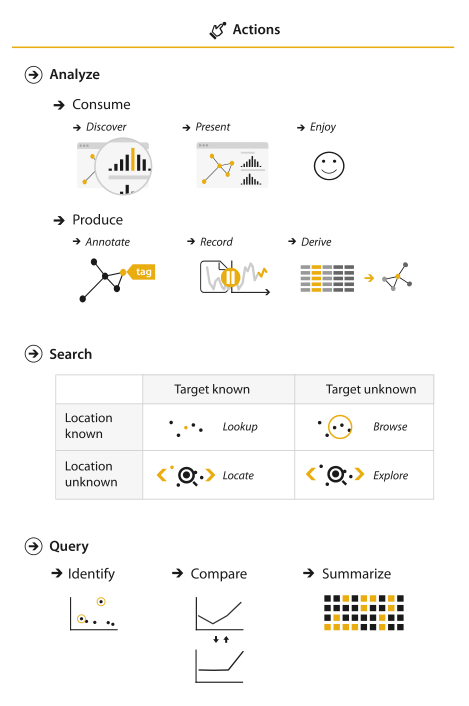
Analyze
Produce
Search
Query
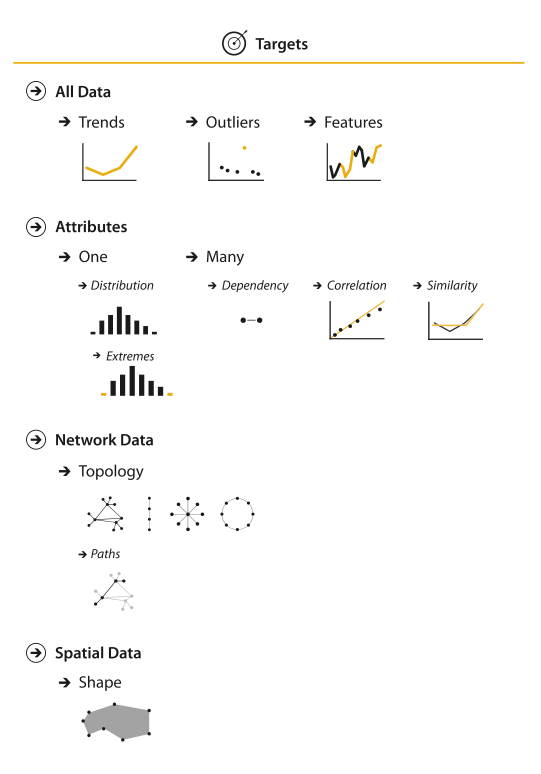
Targets
Analysis: Four Levels for Validation
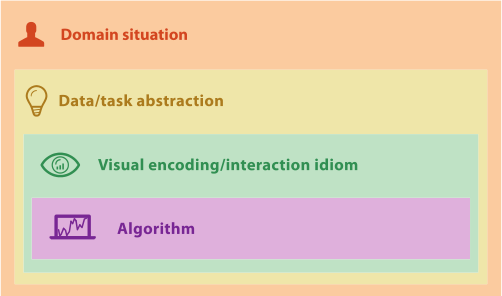
Algorithm
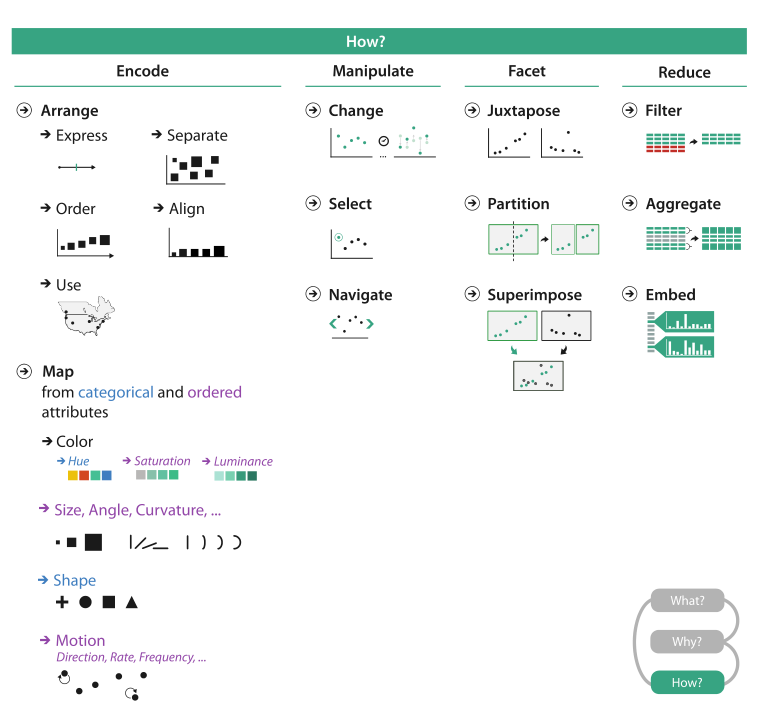
Visual Encoding and Interaction Idiom
Task and Data Abstraction
Domain Situation
Marks and Channels
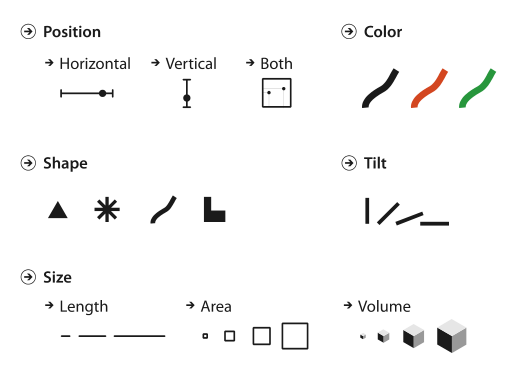
Mark Types
Channel Types
Rules of Thumb
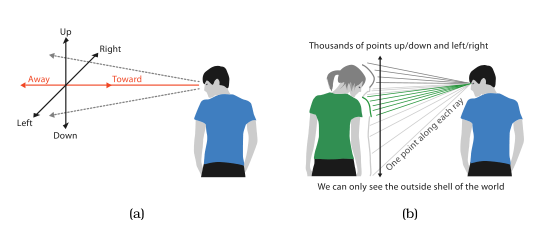
No Unjustified 3D
No Unjustified 2D
Arrange Tables
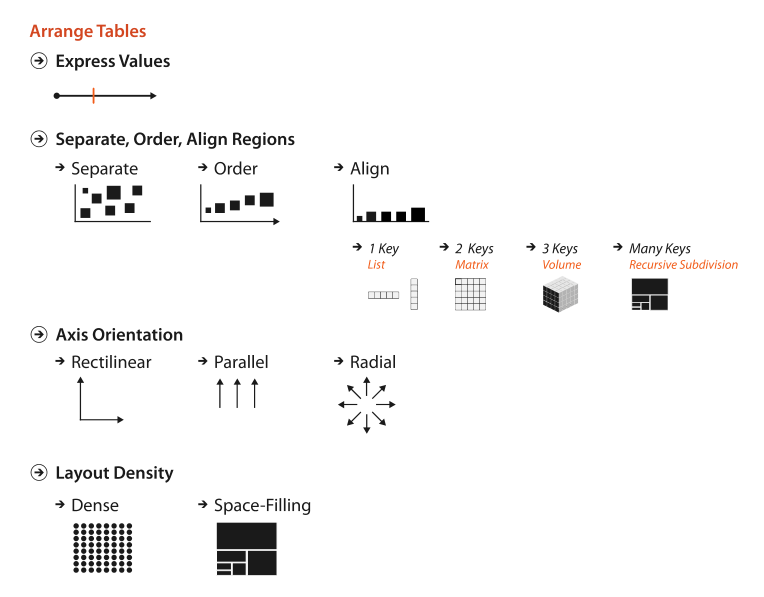
Categorical Regions
List Alignment
Matrix Alignment
Volumetric Grid
Recursive Subdivision
Spatial Axis Orientation
Rectilinear Layouts
Parallel Layouts
Radial Layouts
Spatial Layout Density
Dense
Space-Filling
Arrange Spatial Data
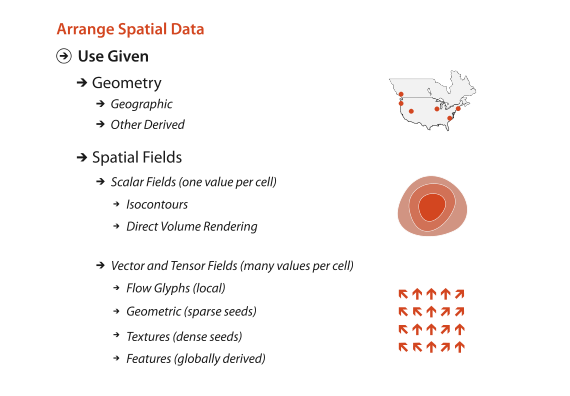
Geometry
Scalar Fields
Vector Fields
Tensor Fields
Arrange Networks and Trees
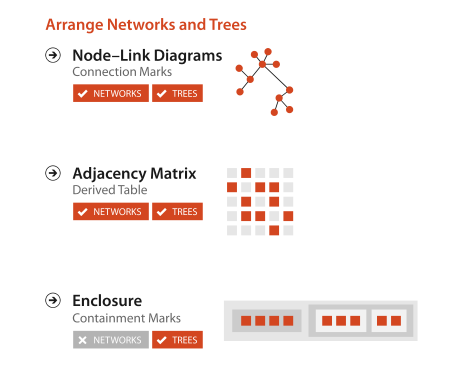
Connection
Matrix
Map Color and Other Channels
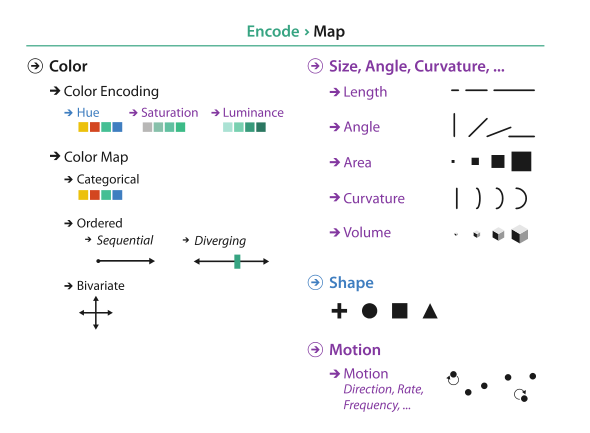
Color Theory
Color Maps
Categorical ColorMaps
Ordered ColorMaps
Bivariate ColorMaps
Color Channels
Size
Angle
Curvature
Shape
Motion
Texure
Manipulate View
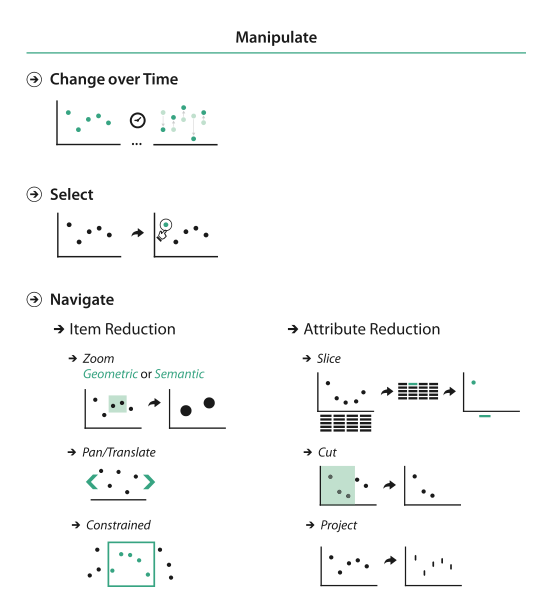
change time
select elements
change viewpoint
reduce attributes
Facet into Multiple Views
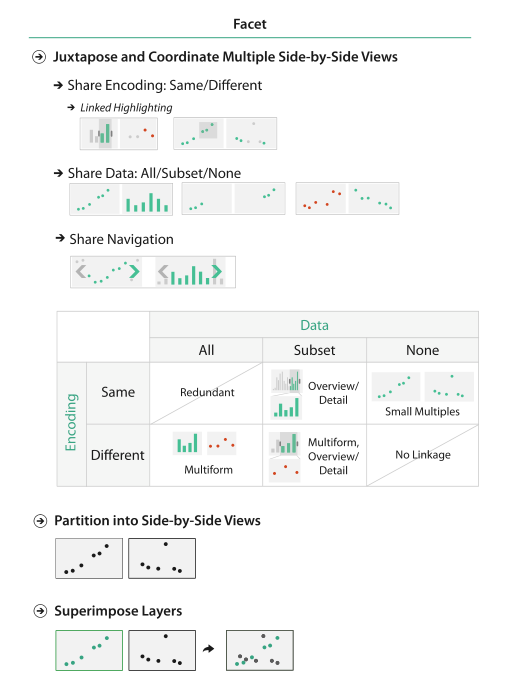
juxtapose and coordinate views
partition into views
superimpose layers
Reduce Items and Attributes
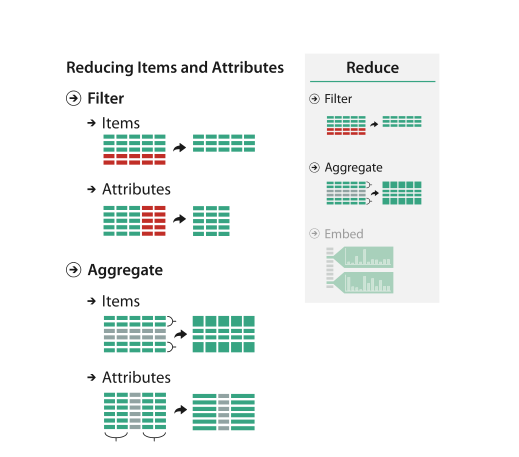
Filter
Aggregate
Embed: Focus + Context
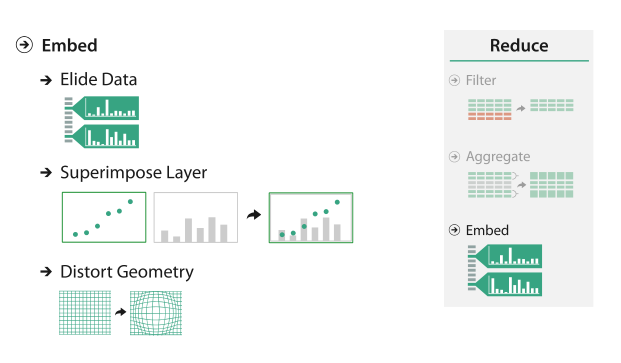
Elide
Superimpose
Distort
Analysis Case Studies
附件
Visualization Analysis and Design.xmind


